Dashboards your team will actually open
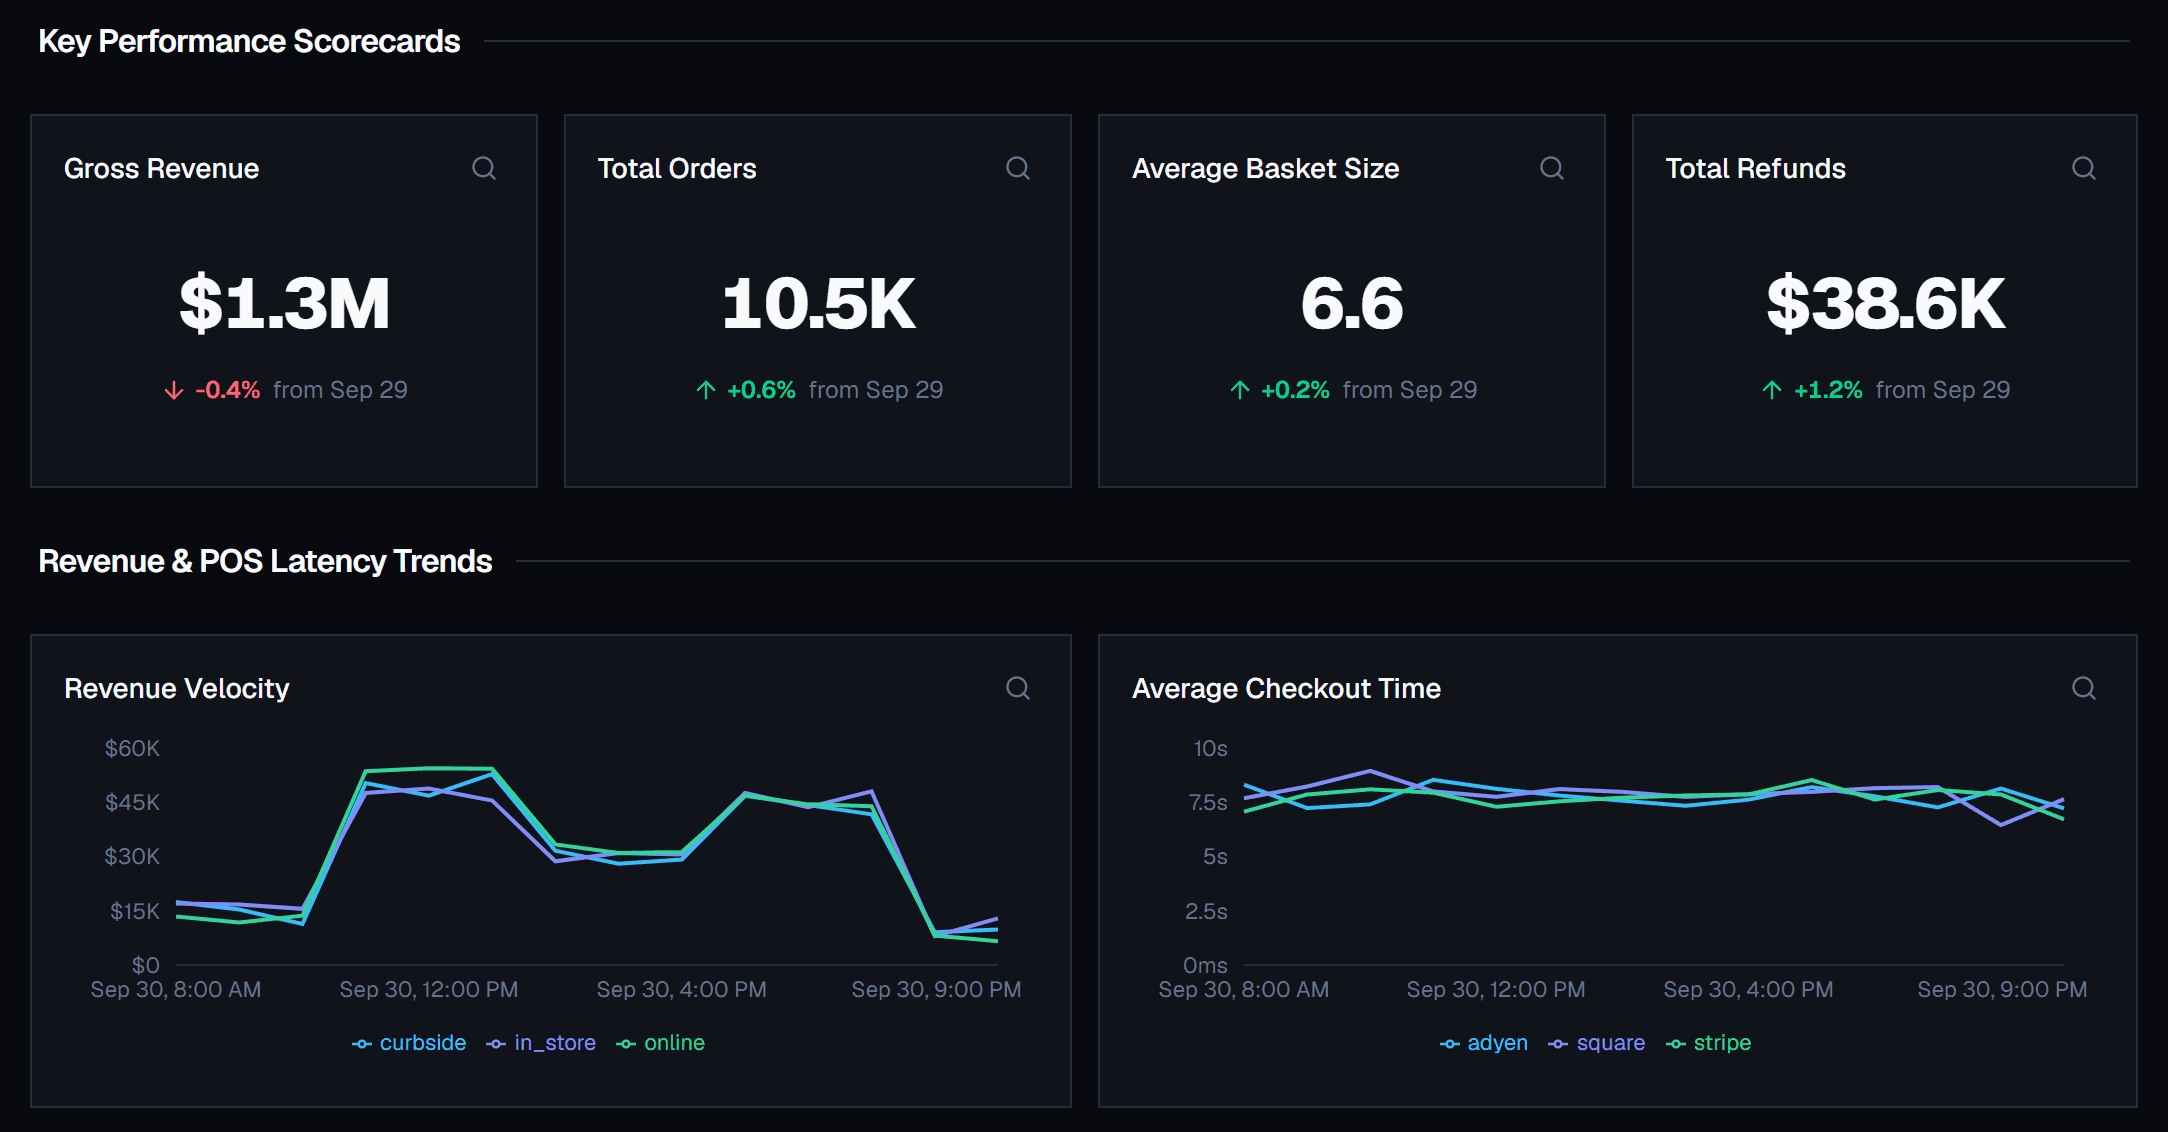
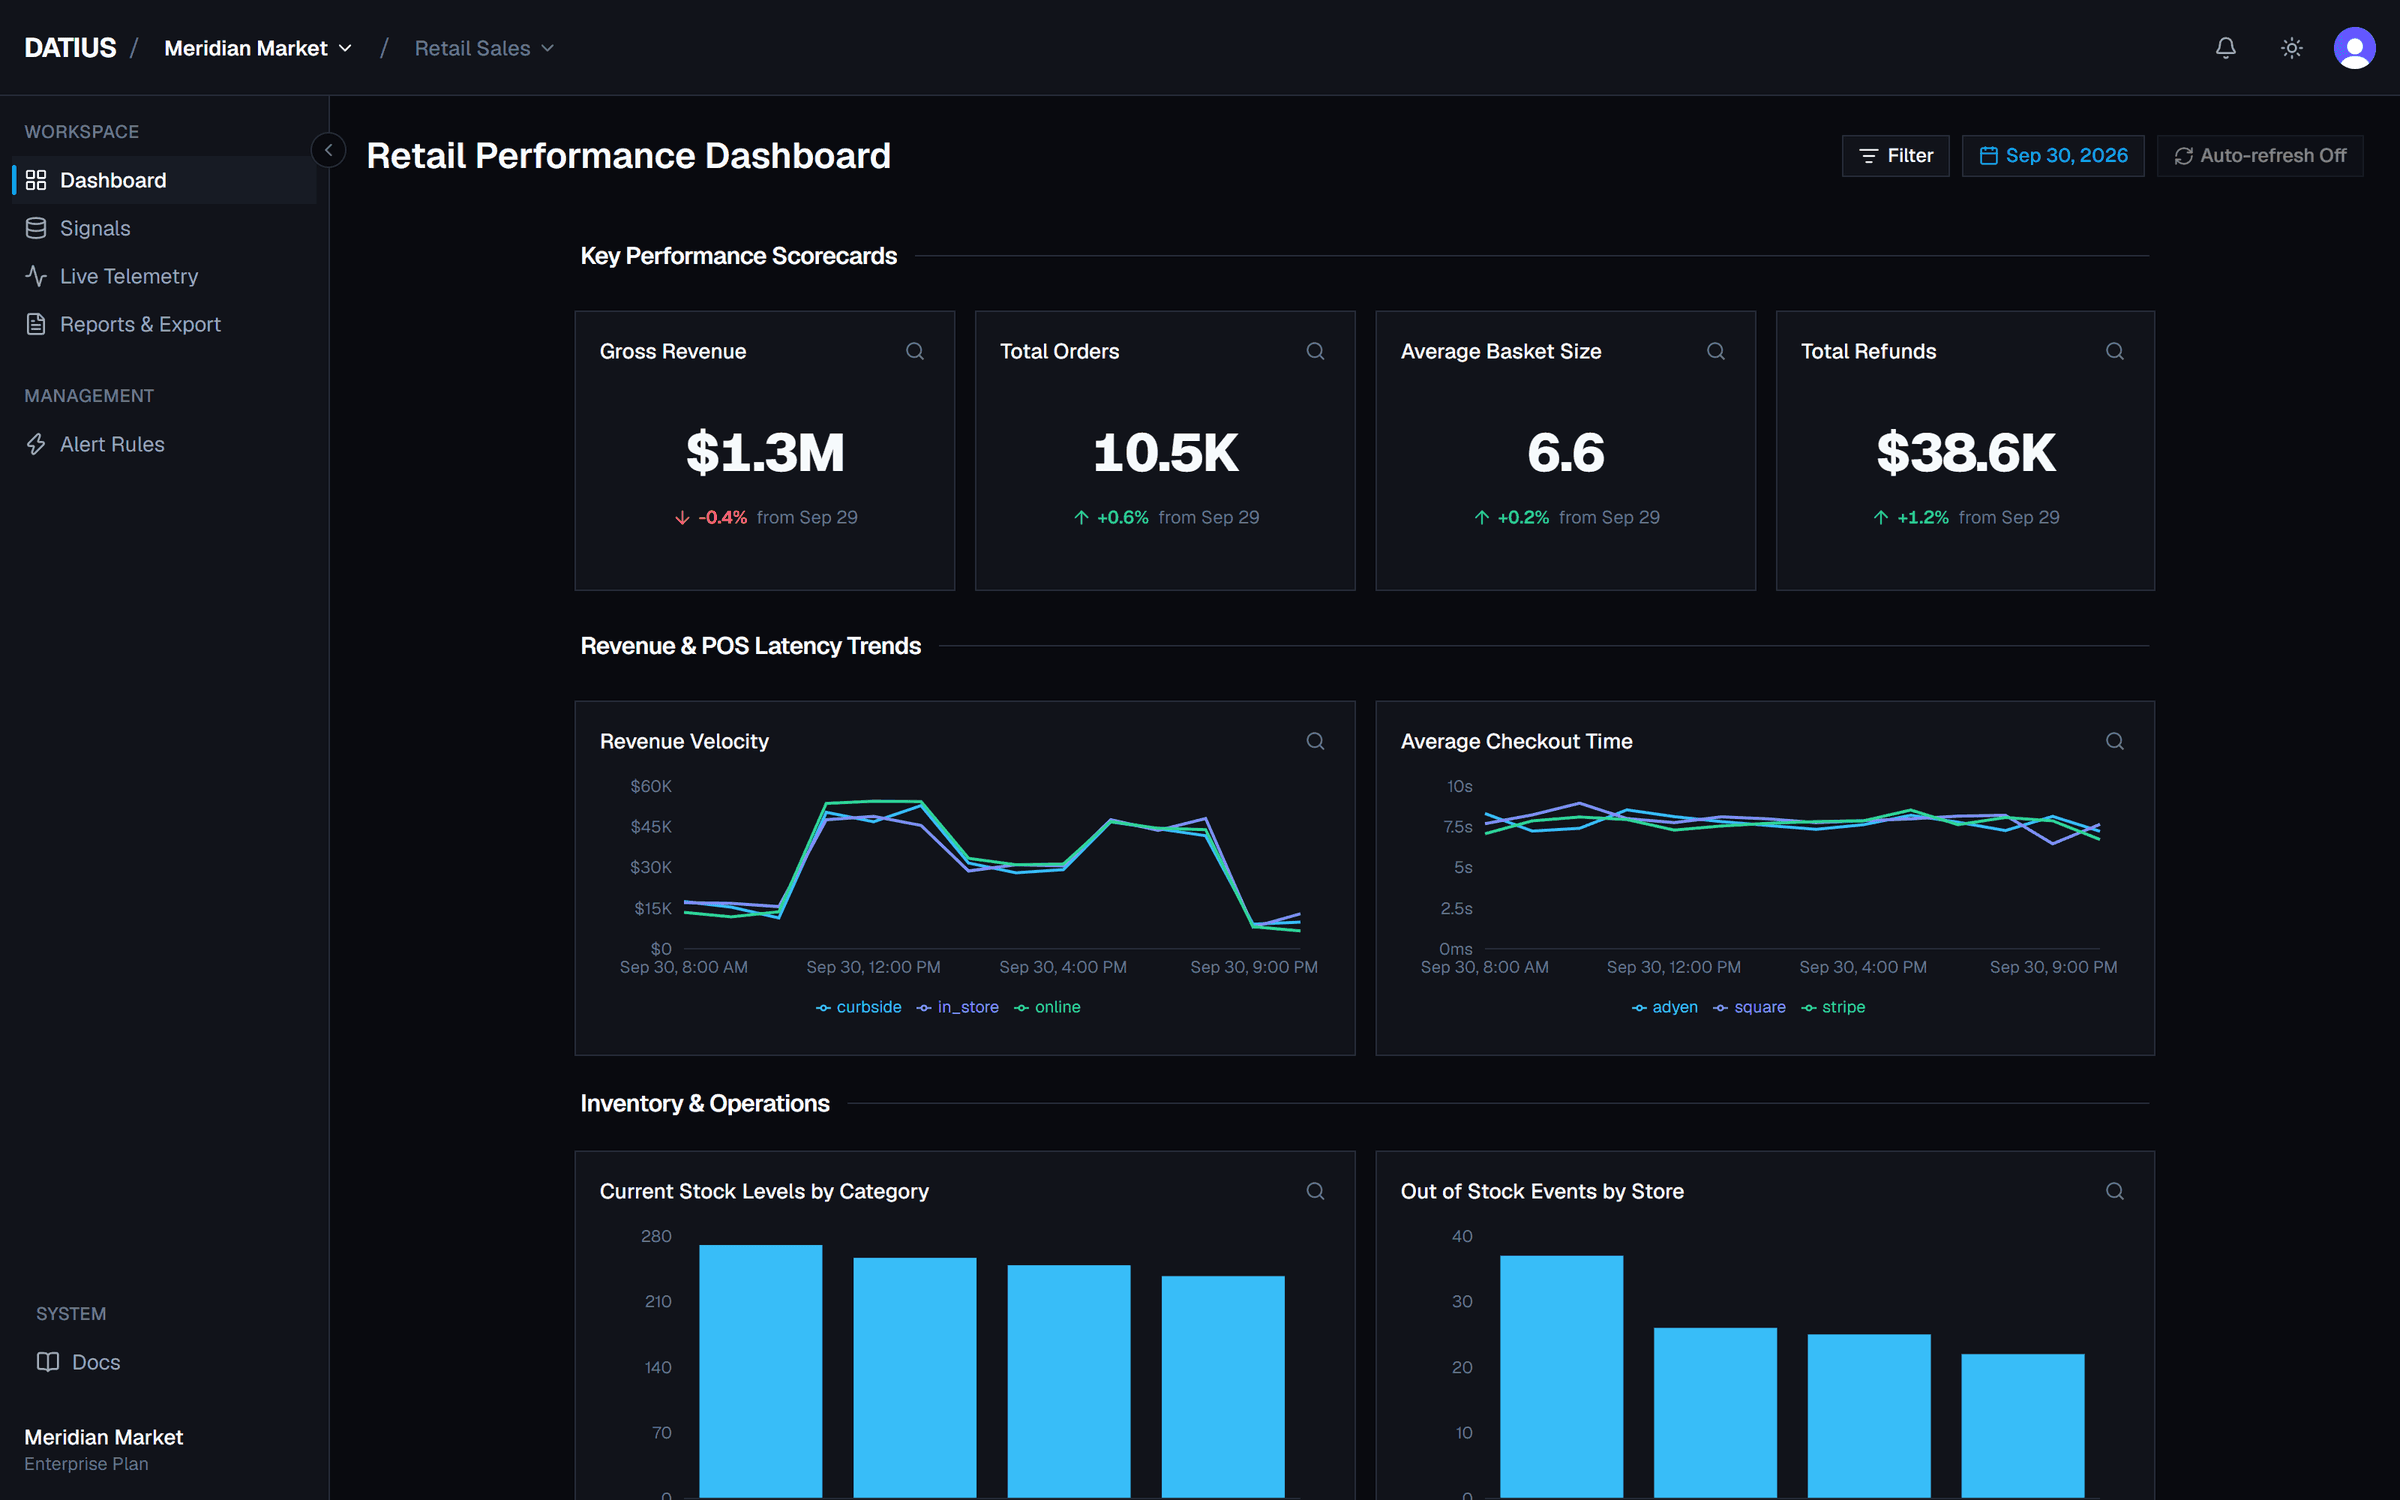
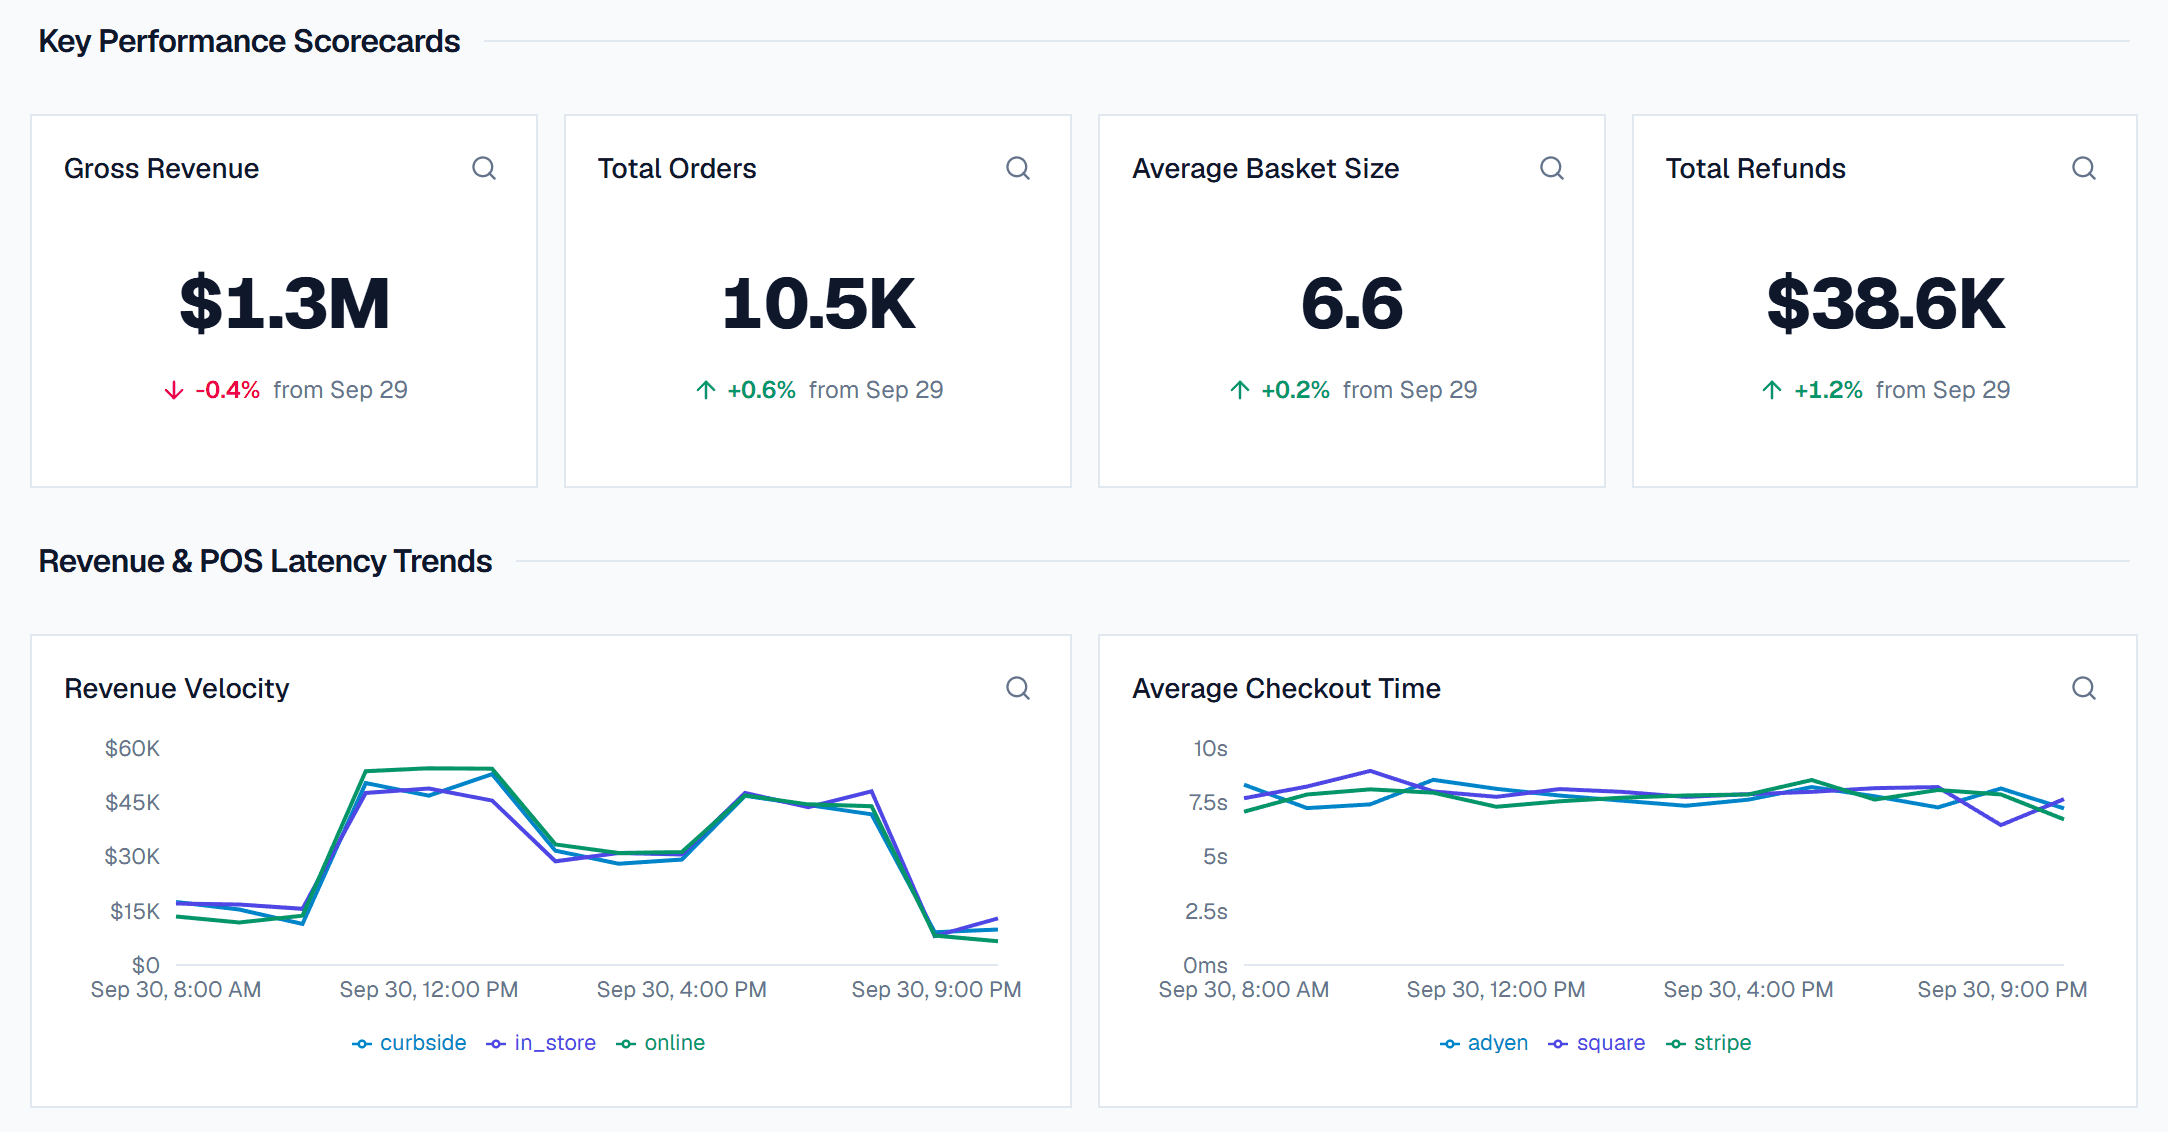
Scorecards, line, bar and pie charts. Combine signals into derived metrics like average order value, then look back at any day.
Send business events from your code. Datius turns them into live dashboards, alerts and reports your whole team can read.
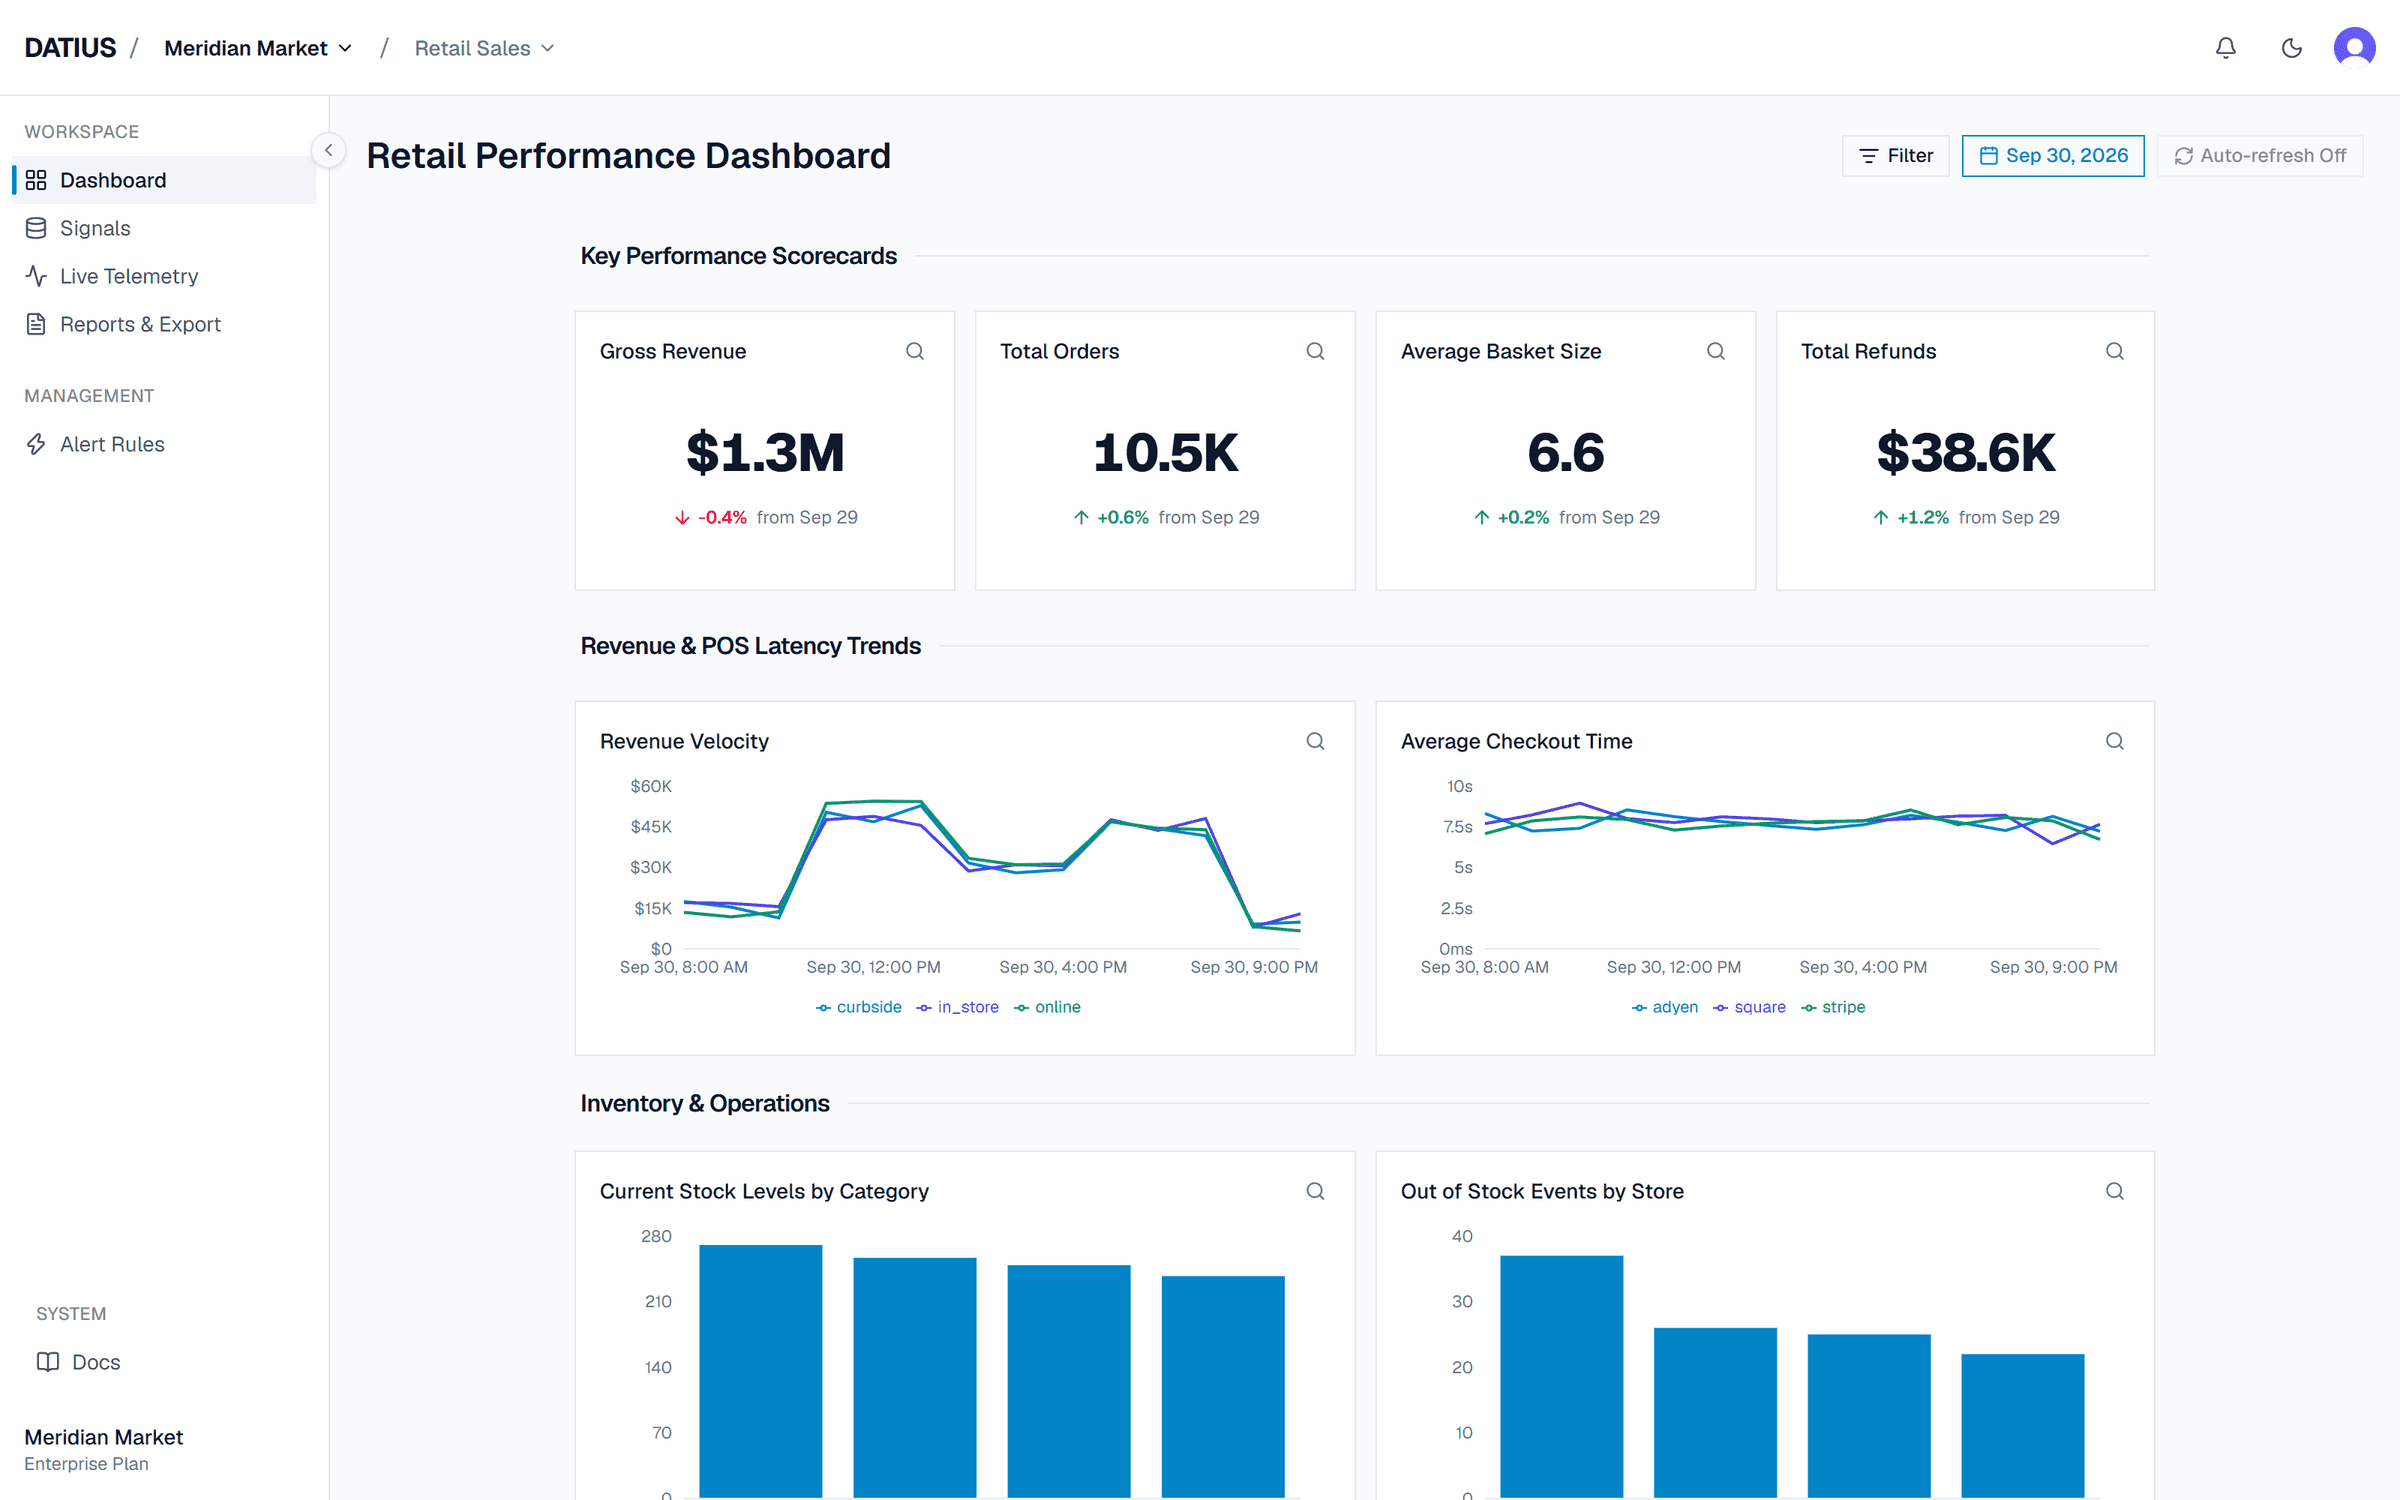
Monitoring tools tell you the checkout server is up. Datius tells you orders dropped by a third at two o'clock, and which store it started in.
import { Datius } from "@datius/node";const datius = new Datius({ apiKey: process.env.DATIUS_API_KEY, endpoint: "https://datius.io",});// After an order is paiddatius.emit("order_revenue", { value: 84.5, tags: { store: "denver", channel: "web" },});Every plan, including the free one, gets dashboards, the live view, alerts and reports.
Scorecards, line, bar and pie charts. Combine signals into derived metrics like average order value, then look back at any day.
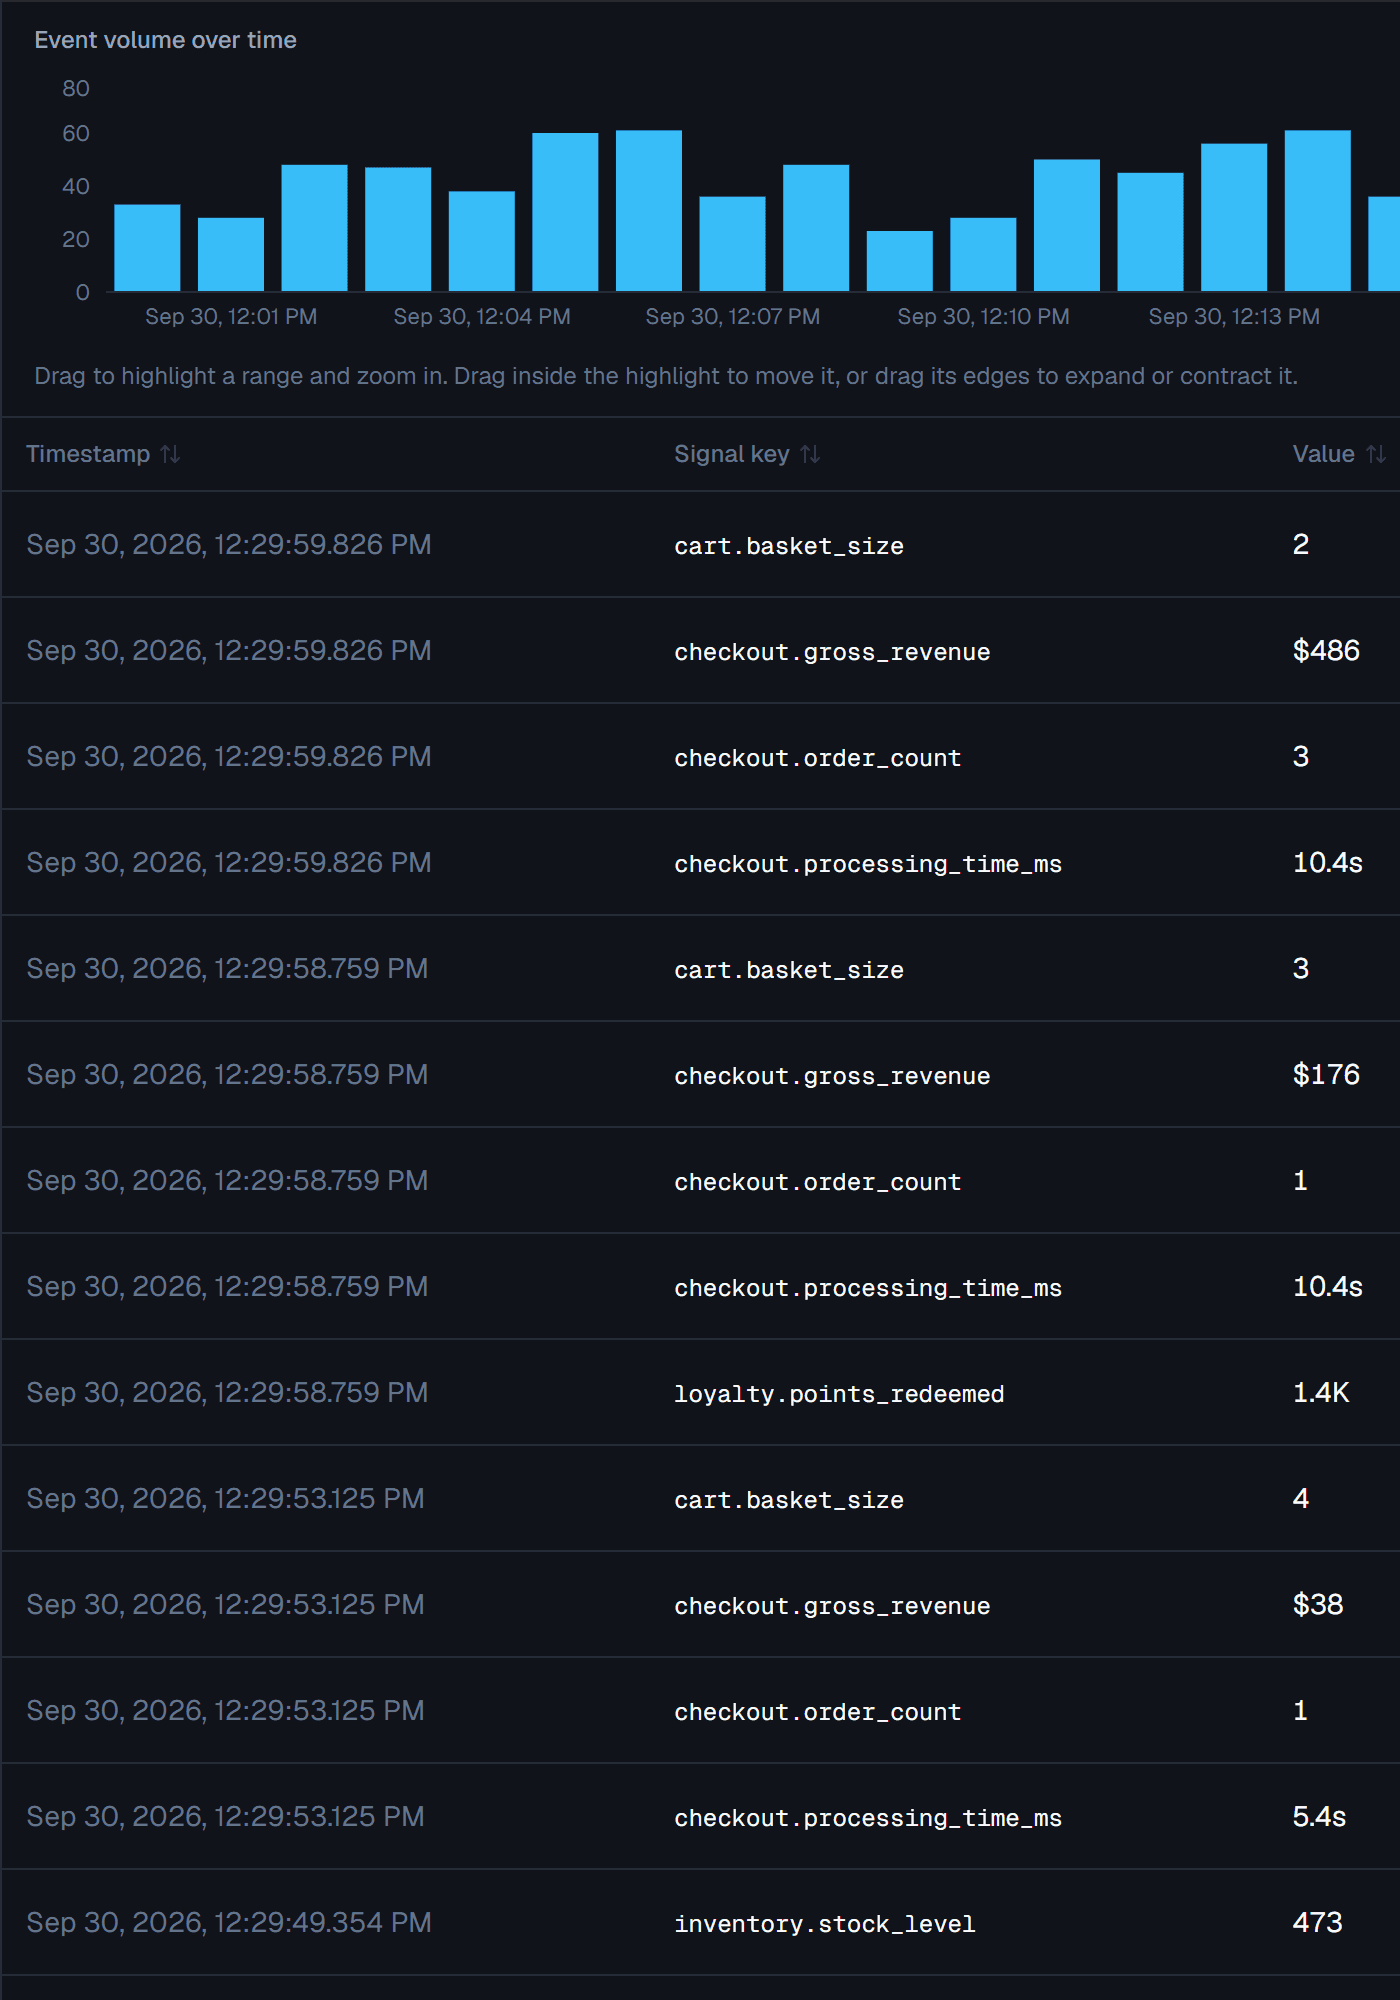
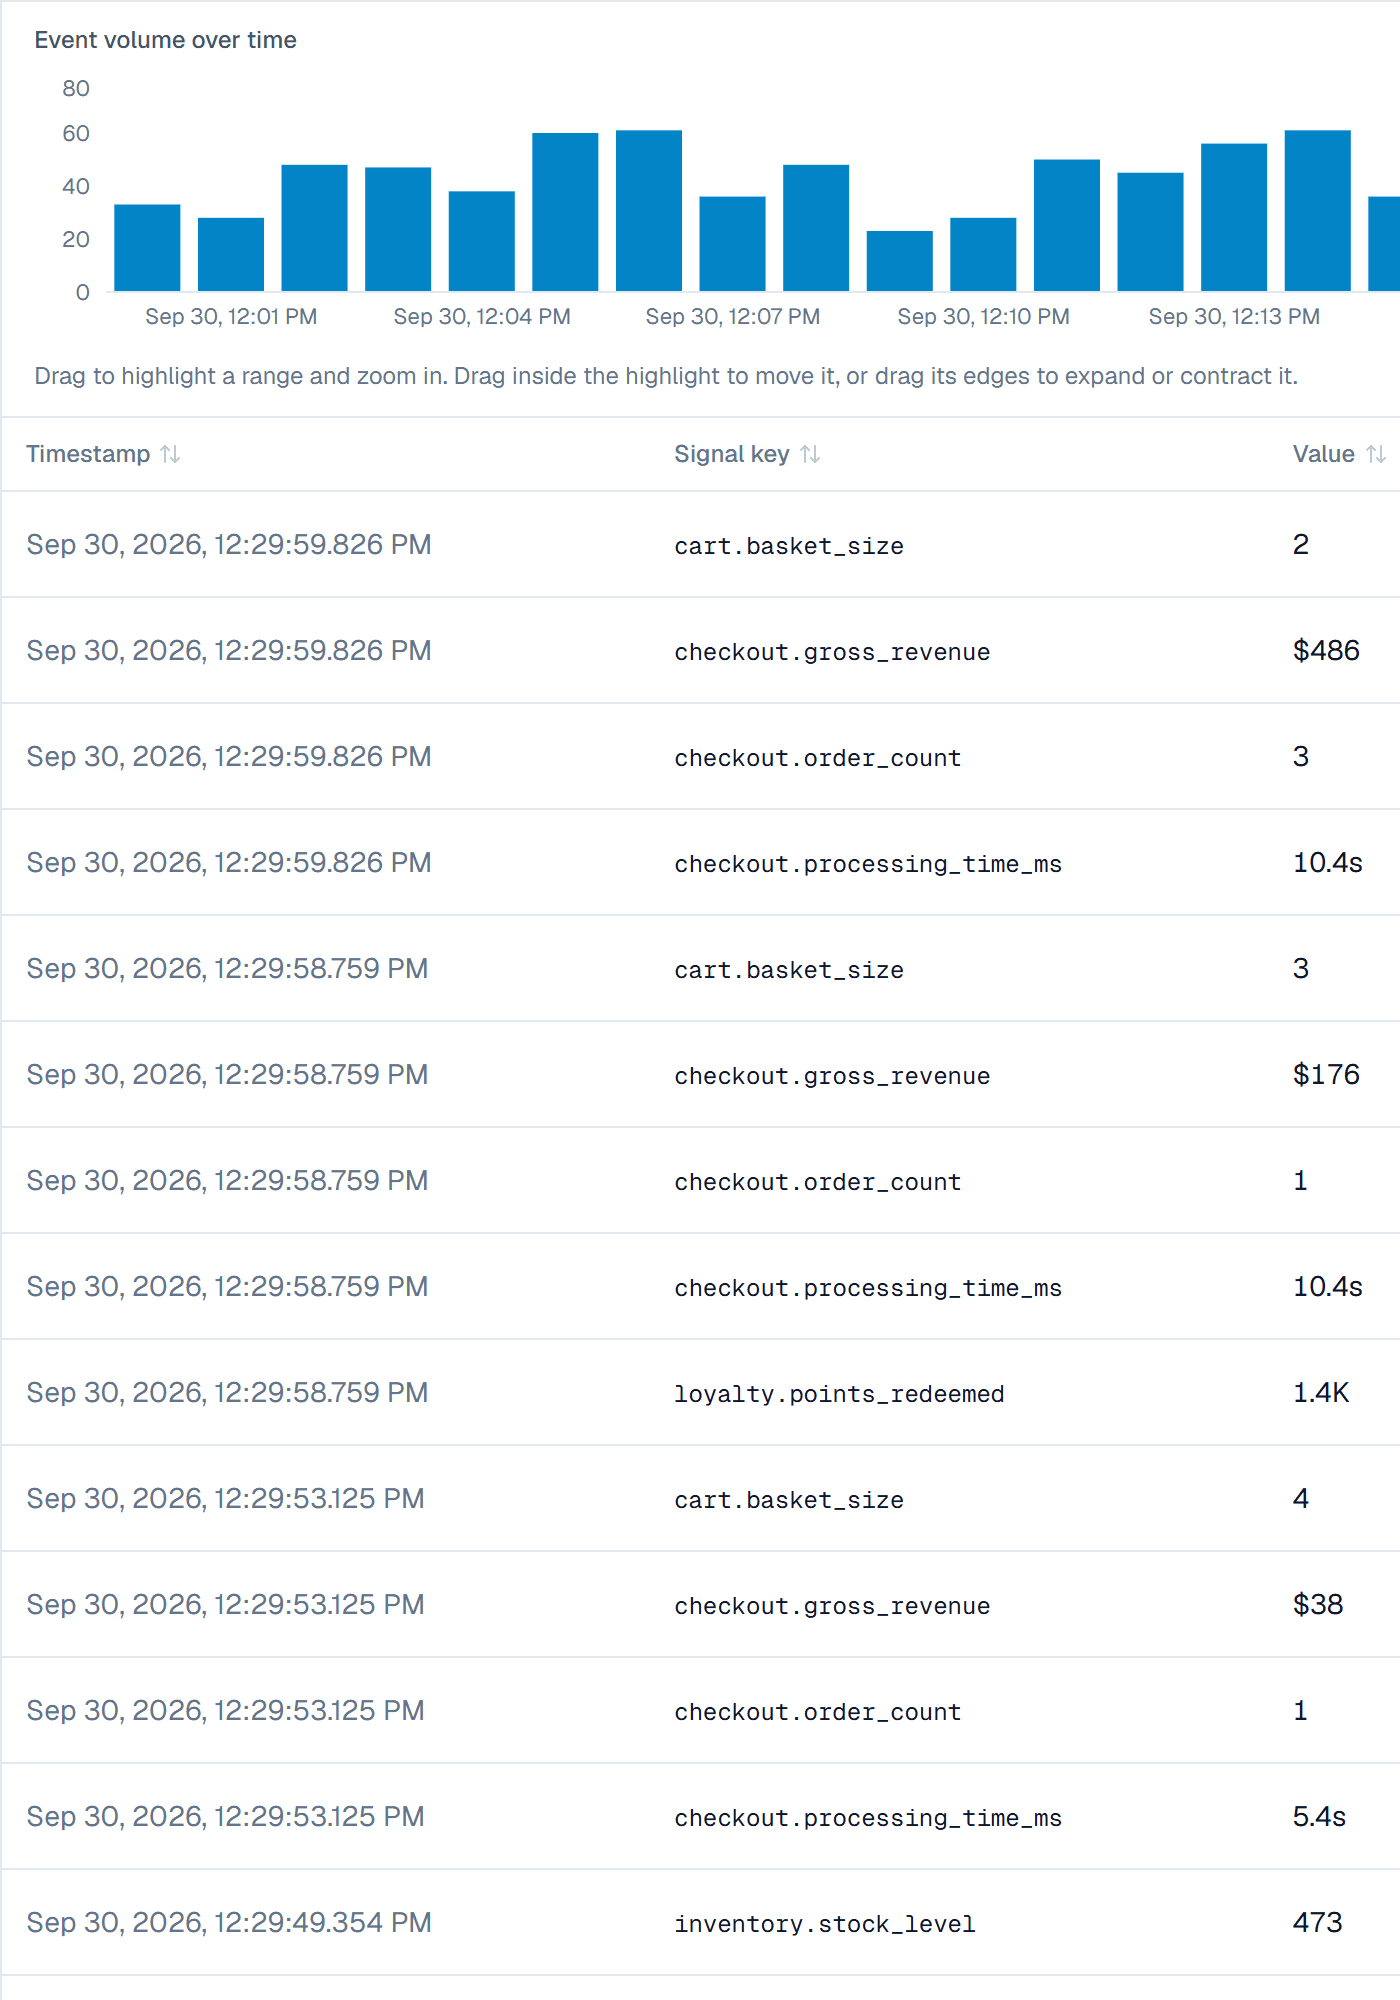
The live view lists every value as it lands, so you can check an integration the moment it ships.
Set a threshold on any signal and get told in the app or by webhook. Pro and Enterprise can send email too.

Break any signal down by its tags over any date range, then export it for finance.
Already on OTel? Map existing metrics and traces to signals, no new code. Enterprise plan.
Telemetry is stored as Parquet files. On Pro and Enterprise they can live in your own storage bucket.
Follow revenue and orders by store and channel, and catch a slow checkout the day it starts.
| Signal | Type | Tags |
|---|---|---|
| order_revenue | Currency | storechannel |
| orders_placed | Counter | storechannel |
| checkout_conversion | Percentage | device |
| checkout_time | Duration | payment_method |
Keep your monitoring for uptime. Use Datius for the numbers the rest of the company asks about.
Community costs nothing and needs no card. Upgrade when the team or the volume grows.